
Booming Job Opportunities in African Solar: How to Attract and Retain Human Capital in A Solar Market Under High Pressure!
A few years ago, I noticed that as the new year began, new names showed up in old mail threads. They were not “new” per se, I simply associated them with other solar companies or bodies. As time went by, I noticed more of this “shuffling” – which is very commonplace. Today, when people call to ask me about a service they know I can provide, they end the call by asking which company I am with so they can update their records. The solar sector is such a close-knit community – a growing family in which everyone has worked with everyone.
“Between 2011 and 2020, solar capacity in Africa grew at an average compound annual growth rate (CAGR) of 54%, two and a half times that of wind (22.5%), almost four times that of geothermal (14.7%) and almost 17 times that of hydropower (3.2%).” – IRENA, 2022.
The growth in the last decade is seemingly nothing compared to future growth statistics – see below image which shows solar potential capacity in Africa
There are also statistics that show that by 2030, about 80% of the jobs created in the renewable energy space would be solar. Clearly, the need to attract more than our usual “shufflers”, and retain them, is paramount.
I personally believe that market/brand positioning is key to talent attraction – and to an extent, retention. By market positioning, I am referring to a customer/consumer’s perception of a company or brand in relation to competing companies or brands. It involves deliberately establishing an image or identity so that the company is perceived in a preferred way.
As a technical sales engineer, understanding the competitive landscape is my forte. I categorize companies in quartiles with respect to pricing, performance and perception, as shown below.
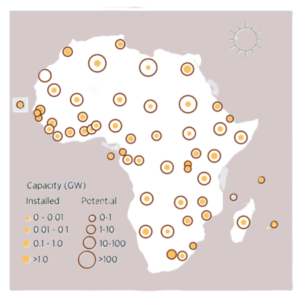
Source: Solar potential, Africa: IRENA; Installed solar capacity, Africa: IRENA, 2021a; Base map: UN boundaries

This categorization helps me visualize the market and easily navigate the waters.
- Pricing: competitive pricing of goods and services. How expensive are their products/services?
- Perception: how the company is viewed in the sector. Are they reliable? Do they have a good reputation?
- Performance: the quality of work. Are there issues with their installations/products? What type of projects do they execute well – residential, commercial & industrial or utility scale?
The truth is, potential employees also have similar considerations – performance, perception, and of course, payment. Although they would rely on word on the grapevine (often through personal connections) to help with positioning companies, corporate bodies can pay for an actual market survey to help understand the competitive landscape. A potential employee may enquire about a potential employer’s position regarding, say, performance in the market or about how well they pay, before deciding to work with them. In this case, an upper quartile company with respect to payment/remuneration and performance, is more likely to attract this talent than a lower quartile company.
Obviously, this is an oversimplification of the assessment process, but it serves as a reliable framework to attract desired human capital.
Therefore, the key to attracting talent – as a company – is to strategically position yourself with respect to the factors that employees usually consider: payment, performance and perception.
To retain the attracted talent, let’s consider what I call a “retention flowchart”.
Fun fact about me: I like to “predict” employees who are likely to switch companies, usually through casual engagement. It is a challenge I have with myself, plus it reduces the surprise element involved in “shuffling”. This way, a deal is never on hold because someone moved. Plus, it is a gain if they moved to a company I have been trying to find a way in. Win-win for everybody!
A good indicator of employee retention is employee satisfaction and employee engagement. This is realized from employee surveys and special HR interventions.
From the flow chart,
- Performance refers to the nature of the employee’s work. Is the employee overwhelmed with work? Is the employee adequately challenged?
- Payment refers to remuneration for work done. Is the employee adequately compensated for work done?
Seldomly, there may be other factors affecting retention that are outside performance and payment, like the need to be with family in another location. These would require a “deep dive” to assess the specific issue and an understanding of the company’s desire to retain said employee in light of the issue. A special intervention may be required but when all fails, it is prudent to prepare for the employee’s departure and attract a replacement.
Attracting and retaining employees requires a lot of creativity as there may be nuances that require specific attention. However, in general, these suggestions should be able to tackle a significant portion of issues faced in this volatile solar family.
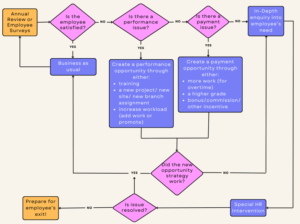
The above flowchart helps digest this. (Note: It is modified a bit for this article.)